Introduction
Images is one of the most important medium for conveying information, the process of extracting meaningful information from images is known as image segmentation. Image segmentation is the process where digital images are partitioned into multiple smaller segments that contain meaningful information while having similar features and properties. The goal of performing image segmentation is simplification. Representation an image into a form that is more meaningful and easier to analyze. Image segmentation algorithms play an important role in applications such as medical imaging, bio-metric recognition, object detection, target tracking etc.
For many years, images that were segmented were usually in gray-scale due to the fact that computers were not powerful enough to display and manipulate large, full-color data sets. With the advent of more powerful and easily accessible hardware came a shift in the current of research towards the more widely applicable and more complex problem of color segmentation. Color images generally convey more information as opposed to gray-scale images which allow one to obtain more meaningful and robust segmentation. Misclassification problems that may arise when segmenting gray-scale images can be easily avoided by resorting to color information.
Although image segmentation remains a very hot area of research for the image processing field. Up til now, it is still a challenging task for researchers and developers to create a universal technique for segmenting images.
Literature Review
An extensive literature review related to image segmentation was carried out. The review seeks to survey available segmentation techniques and to understand their characteristics. The techniques that were surveys include edge detection, thresholding, clustering, region-based, and hybrid approaches.
Edge detection methods assumes that pixel properties (e.g. intensity, color or texture) would change abruptly between different regions. Thresholding is based on the principle that segments of an image can be identified by delineating peaks, valleys, and shapes in its corresponding intensity histogram. Clustering techniques attempts to access the relationship among patterns of the data set by organizing the patterns into groups of clusters such that patterns within a cluster are more similar to each other than patterns fit in to different clusters. Region based methods assume that neighboring pixel within the same region or pixel should have similar values. Hybrid methods tend to coalesce boundary detection and region based methods together to achieve better segmentation.
Edge Detection Approach
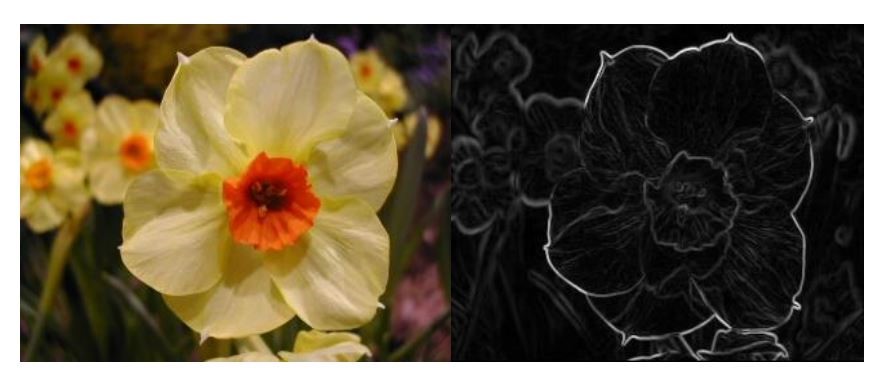
Figure 1: Edge detection
Edge detection attempts to resolve image segmentation by locating edges or pixels between different regions that shows rapid change or transition in intensity values. Edge detection techniques locate edges where either the 1st derivative of intensity is greater than a specified threshold or the 2nd derivative has zero crossings. All the edges are identified and then connected together to form the boundaries of the object that will be segmented. In other words, the result is an outline of borders. The 2 basic edge-detection methods are: Gray Level and Gradient Based methods. To detect the edges, one of the basic edge detection operators can be used such as Sobel operator, Canny operator etc.
Sharada Mani proposed a method that utilizes simple Circular Shifting for manipulating the whole image at a time rather than template based (Sharada Mani, 2010). As pre-processing step, real complement of each channel was taken and the circular shift operations were applied in all directions in order to determine the edge pixels on the resultant image. This process was considered to be attractive in a computational perspective since the underlying operations at edge point effectively reduce to shift and subtraction. Advantages: Performance of the proposed method is satisfactory in almost all cases and runs in polynomial time.
Genyun Sun presents an edge detection algorithm based on calculations of the difference in values of 2 clusters (Sun, 2011). For every pixel, a window is first defined by placing the pixel at the center. This window is partitioned into 2 sub-regions respectively in 4 different directions. An appropriate function is then chosen to estimate the difference between each pair of 2 adjacent regions and also to calculate edge information in terms of edge strength and direction by maximizing the difference value. Finally, the non-maxima suppression is adopted to derive the output edge map. Advantages: More robust under noisy conditions. It is consistent and reliable even when image quality is significantly degraded by noise.
Thesholding Approach
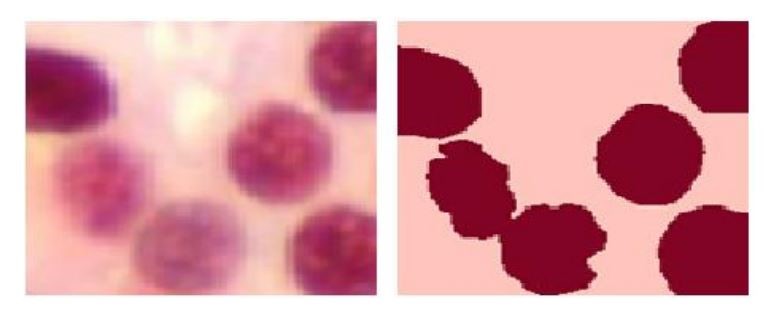
Figure 2: Thesholding Method
Thresholding methods are one of the simplest approaches for image segmentation. These methods divide the image pixels with respect to their intensity levels. This approach is used for images with light objects and darker backgrounds. Thresholding operation converts a multi-level image into a binary image. E.g. it chooses a proper threshold T to divide the image pixels into several regions and separate objects from the background. The image is segmented by grouping all pixels with intensity values greater than the threshold into one class and the other remaining pixels into another class.
Rafika Harrabi proposed a technique that combines many realizations of the same image (Rafika Harrabi, 2012). First, most significant peaks of the histogram is determined by utilizing an optimal multi-level thresholding technique based on the 2-stage Otsu optimization approach. Then, the evidence theory is employed to merge multiple images represented in different color spaces. This was done in order to obtain a final reliable and accurate result. The notion of mass functions, in the Dempster-Shafer (DS) evidence theory, is linked to the Gaussian distribution, and the final segmentation is achieved. On the input image, it is expressed in different color spaces, by using DS combination rule and decision. Advantages: High segmentation sensitivity.
Wu Kaihua and Ban Tao have proposed an optimal threshold segmentation method that is based on the entropy criteria and Genetic algorithm in order to improve the image acquisition process in computer vision. The factors that were taken into account were illumination, light, reflection of light, CCD exposure time and some properties of image histogram. Advantages: Efficient in searching and finding threshold.
Cluster Based Approach
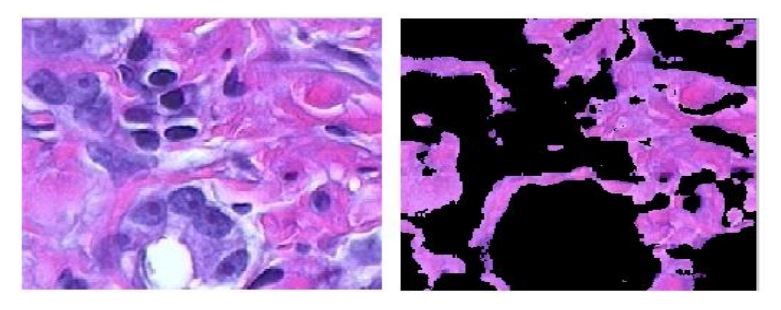
Figure 3: Cluster Based Segmentation Method
Clustering based techniques segment images into clusters that contain pixels with similar characteristics. A similarity criteria is defined between pixels, and then similar pixels are grouped together to form clusters. The grouping of pixels into clusters is based on the principle of maximizing the intra class similarity and maximizing the inter class similarity. Clustering technique attempts to access the relationship among patterns of the set by organizing the patterns into group such that the pattern within a cluster are more similar to each other than patterns that belong to another cluster.
Ghassan Hamarneh proposed a novel method for enhancing watershed segmentation by using prior shape and appearance knowledge (Ghassan Hamarneh, 2009). The method iteratively aligns a shape histogram with the result of an improved k-means clustering algorithm of the watershed segments. The method comprises a training stage and a segmentation stage. In the training stage, a ‘shape histogram’ and image intensity statistics are used to model prior shape and appearance knowledge, respectively. The segmentation stage is an automatic iterative procedure and consists of 4 steps: Classical Watershed Transformation, Improved K-Means Clustering, Shape Alignment, and Refinement. Advantages: Automatically locates and segments the target, overcomes some intrinsic problems with watershed transformation.
Biplab Banerjee proposed a method for image segmentation that involves the use of Minimum Spanning Tree (MST) (Biplab Banerjee, 2010). First, MST is performed based on the “natural grouping” of the image pixels to determine the clusters of the pixels that have TGB values within a certain range present in the image. Then, the pixels closest to the centers of those clusters are identified and labeled as the seeds for region growing based segmentation. After that, a region merging based segmentation having a suitable threshold is carried out to remove the effect of over-segmentation that remains after the previous method. Advantages: Eliminate the effect of over segmentation that may persists after region growing method.
Region Based Approach
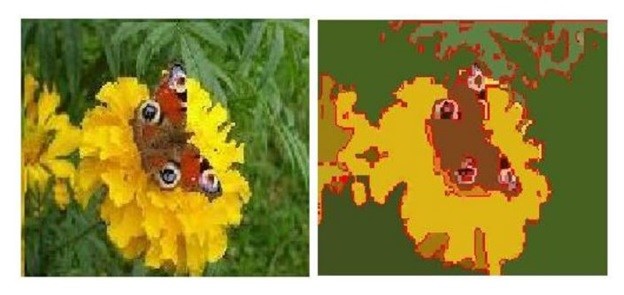
Figure 4: Region based Approaches
Region based approaches such as region growing, splitting, merging and their combinations, attempts to group pixels into homogenous regions. In region growing approach, a seed region is first selected then expanded to include all homogenous neighbors. This process is repeated until all pixels in the image are classified. On the other hand, in the region splitting approach, the initial seed region is simply the entire image. However, if the seed is not homogeneous, it is usually divided into 4 square sub regions, which become new seed regions. The process is repeated until all sub regions are homogenous. As for region merging approach, it is often combined with region growing or region splitting to merge the similar regions for making a homogenous region as large as possible.
Jifeng Ning presented a region merging based automatic tongue segmentation method (Jifeng Ning, 2010). Firstly, gradient vector flow is modified as a scalar diffusion equation to diffuse the tongue image while preserving the edge structures of tongue body. Then the diffused tongue image is segmented into many small regions by using the watershed algorithm. The maximal similarity-based region merging is used to extract the tongue body area under the control of tongue maker. Finally, the snake algorithm is used to refine the region merging result by setting the extracted tongue contour as the initial curve. Advantages: Reduces interference of strong edges around the tongue body, achieves high qualitative and quantitative evaluation measures.
Hybrid Approach
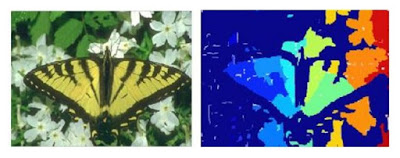
Figure 5: Hybrid Approach
Hybrid approaches are just simply a combination of one or more of the basic segmentation methods. These algorithms succeed to the good quality of several approaches and gives better performance compared its basic segmentation approach.
Y. Deng developed the J-Segmentation (JSEG) algorithm that integrates color quantization and spatial segmentation for extraction of color-texture regions in images and video (Y. Deng, 2001). While the JSEG method was capable in deriving spatially compact regions, the JSEG method commences in a color quantization step utilized to obtain a “color class map” which is subsequently employed to compute a J-image based on certain spatial constraints. These spatial constraints were designed such that the resultant boundaries and low values for homogenous color-texture regions. Subsequently, the J-image is utilized as a reference to identify suitable seed points to initiate a region growing process, wherein the obtained regions are eventually refined in a merging process using a color similarity criterion.
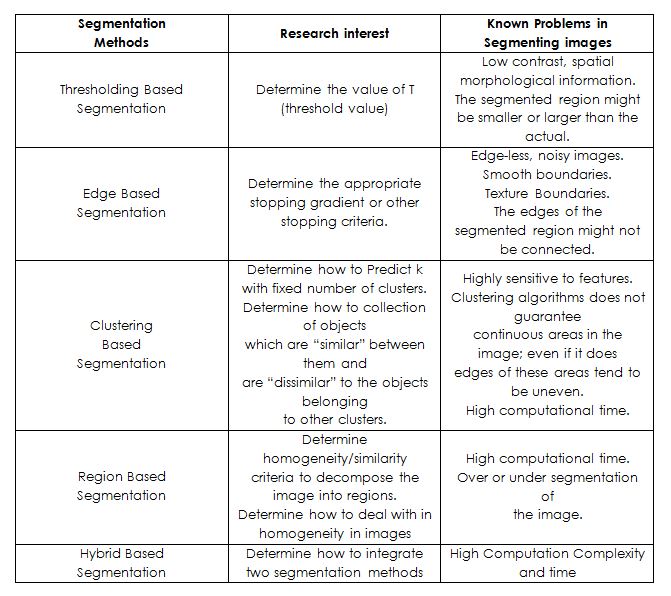
Table 1: Image segmentation methods
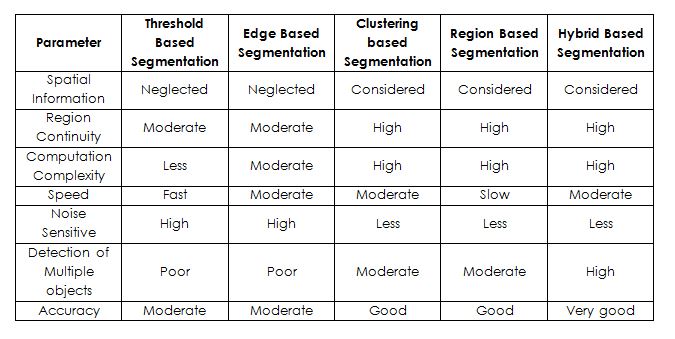
Table 2: Image segmentation parameters
Methodology
Load Image
Firstly, the image is loaded into the program by using a file selector option. A validation is performed in order to ensure that image is valid. Valid images are required to possess 3 planes which signify that only color images are accepted. If validation approves, the image is saved into a variable. The image is then displayed at the axes to assure to user the correct image is selected. Then, the dimensions of the image are computed including the rows, columns and number of planes for further processing. A blank mask is generated in order to be filled with information later on during processing while not affecting the original image. The mask possesses identical dimensions as the image.
Detect Color
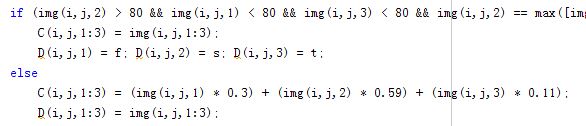
By using the row, columns, and plane information that was provided after loading a valid image, a looping mechanism is generated in order to loop through each and every pixel throughout each planes for processing. There are 2 for loops in total, 1 goes through the rows and 1 goes through the columns. A thresholding technique is used to determine the colors that can be accepted and the colors that are not accepted.
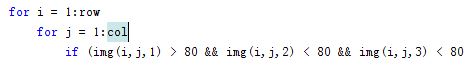
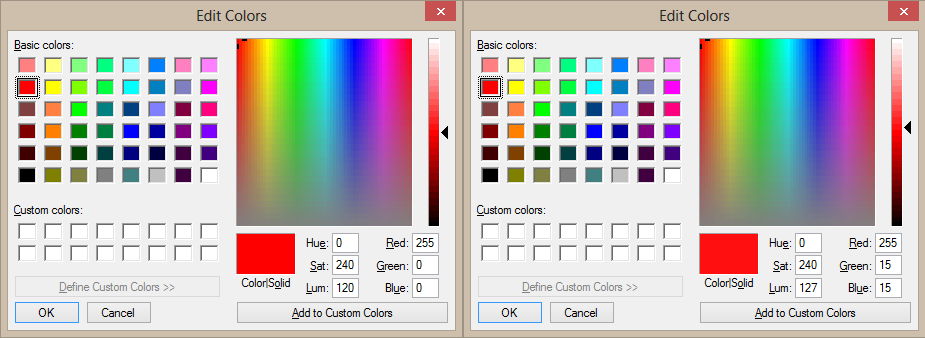
For example, the above code is to detect the color ‘Red’. As we know the color ‘Red’ is a combination of 255 in the ‘r’ plane, 0 in the ‘g’ plane, 0 in the ‘b’ plane. However, by setting a threshold with the value of 255 for the first plane and threshold of 0 in the remaining planes would only allow pure ‘Red’ values to be obtained. In other words, slightly bright red pixels would not be accepted and thus causing a very strict extraction that only accepts pure ‘Red’. The image below shows 2 red pixels. The one of the left is purely ‘Red’ by having 255 in the ‘r’ plane and the rest of the planes having 0. The one on the right is still ‘Red’ with 255 in the ‘r’ plane but 15 in the remaining planes. As we can see both are actually ‘Red’ even though they have slightly differences in plane values. Images often have differences in brightness and contrast, thus not all pixels will be as absolute as the example below. Therefore, upper and lower limit are set to provide a range of values that can be accepted in order to obtain a more satisfying result.
The thresholding is performed for each color but the thresholding values is not the same. This is due to the fact that different colors have their own respective plane values. E.g. ‘Green’ would have 0 in the ‘r’ plane, 255 in the ‘g’ plane and 0 in the ‘b’ plane which is not the same as the color ‘Red’. Once the pixel is accepted in whichever color range’s threshold, a counter is incremented to record the occurrence of the that particular color value in the image. For instance, if the pixel is accepted as ‘Red’, the counter would increase to ‘1’, if another pixel is considered as ‘Red’ again, the counter becomes ‘2’. This is for the use of bar chart plotting to display the ratio of colors within the image. If the counter for the color, let’s say ‘Magenta’ is 0, then therefore we know that the image does not contain magenta colors. So the effort of extracting ‘Magenta’ would produce no result. In the end, a bar graph that displays the colors and their occurrence is shown.
Extract Color
The color extraction or segmentation process utilizes the same looping mechanism as mentioned in the color detection phase. Each and every pixel is gone through the mentioned thresholding technique to see if the pixel falls within the range of a specific color. For color extraction, if the pixel falls in the color range of the specified color, the pixel’s information which is all the plane values is copied to the blank mask. In other words, if the segmented color is ‘Red’ and the first pixel of the image was ‘Red’, the blank mask would have the same ‘Red’ in its first pixel. However, it the pixel does not fall within the ‘Red’ color’s threshold range, it would be considered as another color. Therefore, the pixel would be converted to gray. The gray colors are to highlight the extracted color. As a result, the mask is filled with the colors of the specified color and the remaining pixels will contain the value of gray.
In order to extract the specific color from the image, each pixel in the image must be looped through by using 2 for loops. 1 going through the rows, and 1 going through the columns. For each pixel, the range is checked to determine whether the pixel falls within the specified color’s range. If it does, the pixel maintains its values for the 3 planes. If the pixel value does not fall in the range of the specified color, it is converted to gray. Then, the mask is displayed.
Replace Color
The replace color mechanism utilizes the extraction phases’ operation of filling the mask with the specified color however the mask is different from the mentioned but still possess same characteristics. This is for separation purposes. The color replacement phase starts off from there. First of all, the ‘to be replaced’ color and ‘replacing’ color is determined beforehand. For the pixels that falls within the range of the ‘to be replaced’ color, the region of replacement is determined. The region is then filled with the specified color that replaces the existing color. For instance, the color ‘Red’ should be replaced with ‘Yellow’, each time ‘Red’ is determined, the pixel information is copied to the mask, thus the mask contains the ‘Red’ pixels. However, after each pixel is copied to the mask, it is immediately replaced with the color ‘Yellow’. For pixels that do not contain the ‘to be replaced’ colors, unlike the extraction phase where the pixels are filled with gray, it is filled with the original colors of the image. This is to show that the colors from the original image are actually replaced by the replacing color.
Work Done
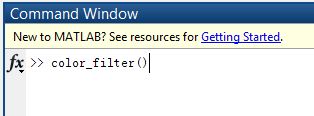
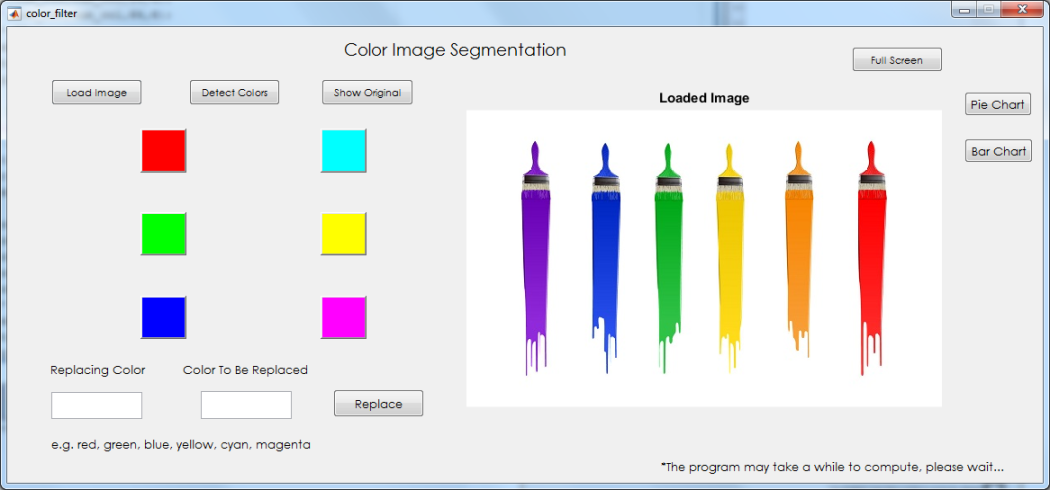
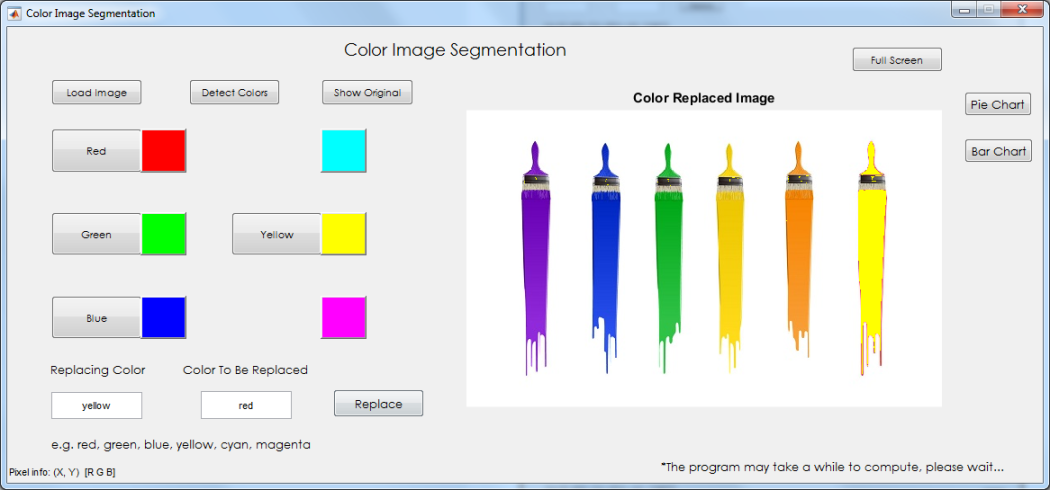
Firstly by calling the function color_filter() in the command window, the user will be presented a GUI interface that contain all the functions related to the color segmentation process.
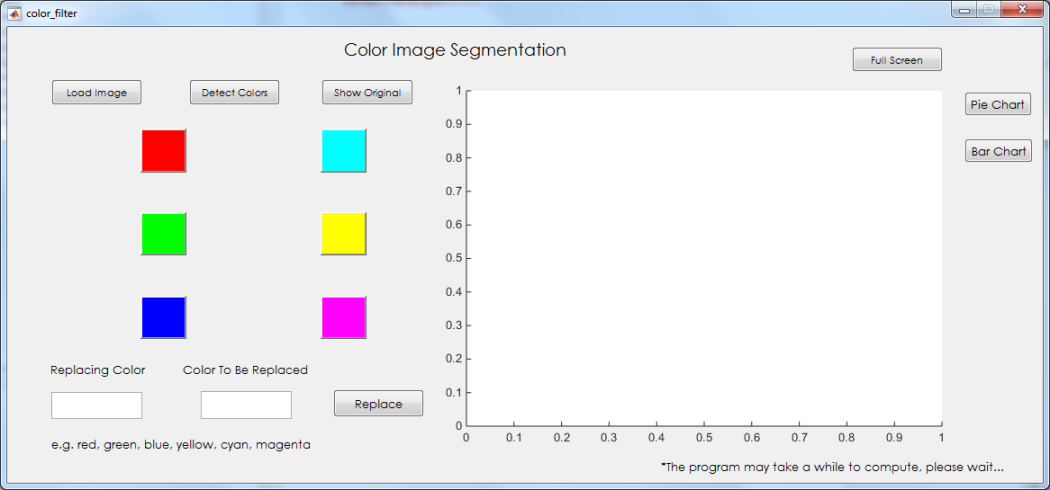
The user first needs to load up an image. Only color images are accepted. Then the image is displayed on the axes to ensure that the correct image is loaded.
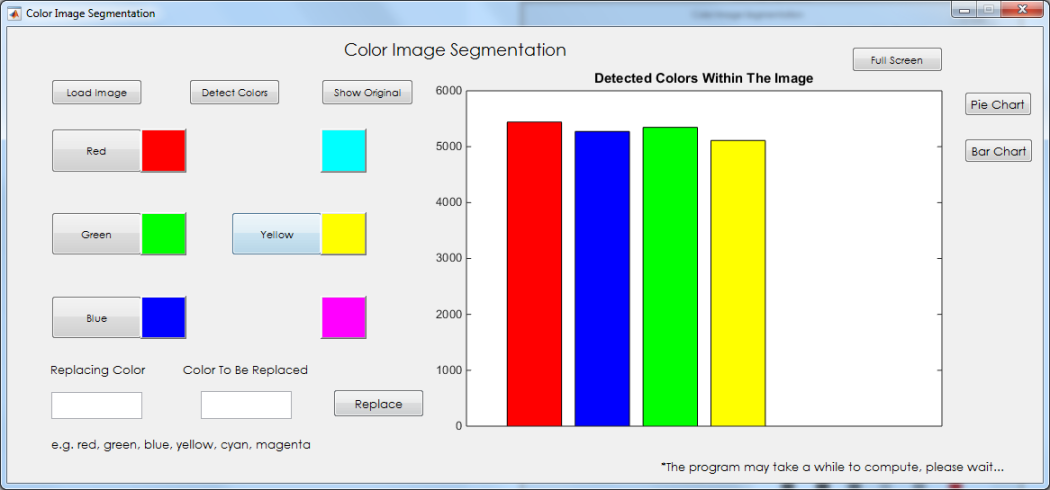
Users then need to use the ‘Detect Colors’ function to identify the available colors in the image to be extracted. A bar graph is presented notifying the user of all the available colors within the image and their respective occurrences.
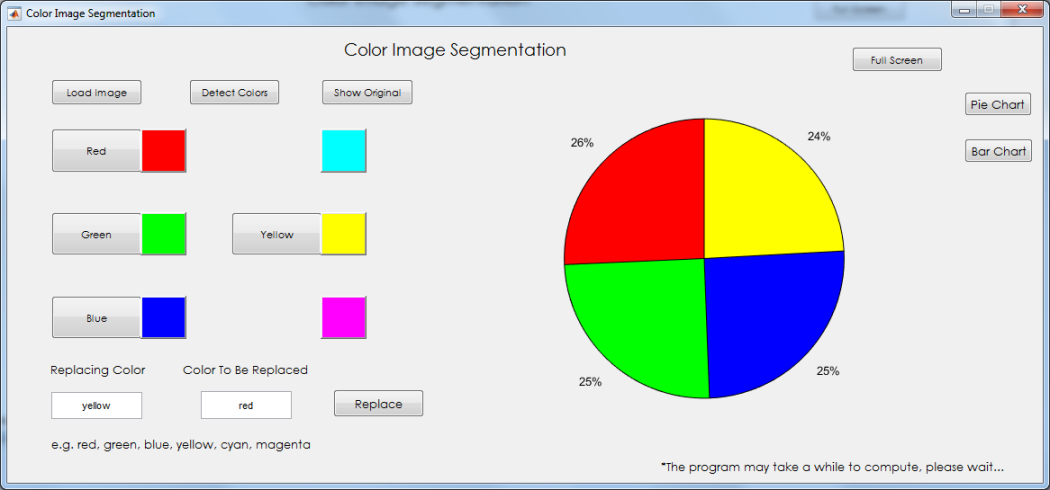
Users may also decide to view a pie chart presentation by pressing the ‘Pie Chart’ button or switch back to bar chart by pressing the ‘bar chart’ button.
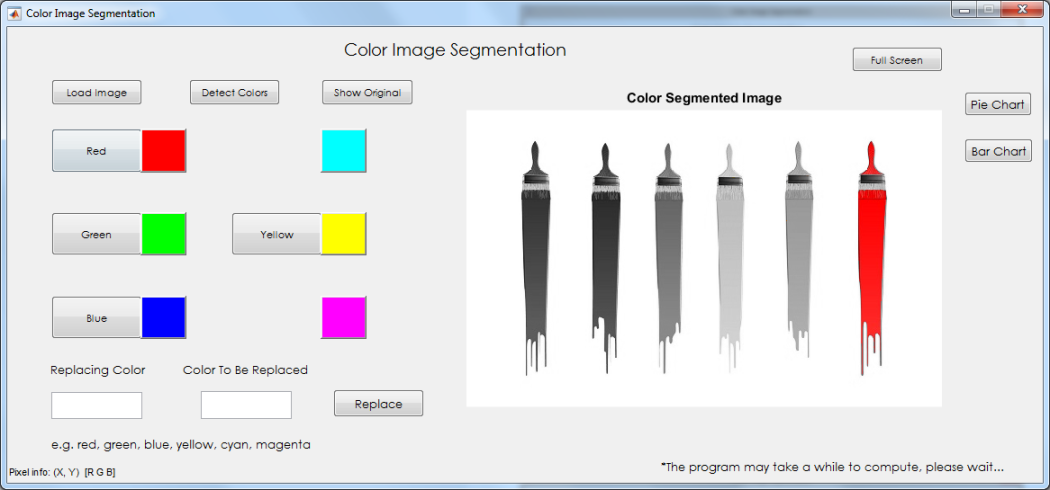
Users may start to extract the colors from the image by using the color buttons. After the segmentation process, the segmented image will be displayed.
Users may also replace colors within the image with another color by using the textboxes. The textbox one the left is for the replacing color and the one of the right is for the color to be replaced. The users are required to enter values into the textbox for color replacement.
Results & Discussions
Color Detection
Results


Discussion
The color detection mechanism produces quite accurate results but are only limited to detecting 6 colors which are ‘Red’, ‘Green’, ‘Blue’, ‘Yellow’, ‘Cyan’, ‘Magenta’. Any other colors apart from those cannot be identified.
Color Segmentation
Results


Discussion
The color segmentation produces fine results when there is not much variation between pixels, thus segmenting out regions with that are nicely filled. With the occurrence of sharp changes in values such as noise, the segmented regions would contain a few holes here and there thus producing a noisy segmented image.
Color Replacement
Results


Discussion
The replacement process produces average results where most of the colors are replaced but some are left untouched. Besides, the resulting color does not possess the same saturation as the replaced color which makes the replacement a one-toned color and more obvious.
Citation
- Biplab Banerjee, T. B. (2010). Color Image Segmentation Technique Using “Natural Grouping” of Pixels.
- Ghassan Hamarneh, X. L. (2009). Watershed segmentation using prior shape and appearence knowledge.
- Jifeng Ning, D. Z. (2010). Automatic tongue image segmentation based on gradient vector flow and region merging.
- Rafika Harrabi, E. B. (2012). Color image segmentation using multi-level thresholding approach and data fusion techniques.
- Sharada Mani, G. S. (2010). A Novel Edge Detection Technique for Color Images.
- Sun, G. (2011). A New Method for Edge Detection Based on the Criterion of Separability.
- Y. Deng, B. M. (2001). Unsupervised segmentation of colortexture regions in images and video.


0 comments:
Post a Comment